On Monday (October 23rd) during Asian trading, spot gold opened significantly lower at around $15 and opened at $1964.81 per ounce. Last Friday, gold prices closed at $1980.24 per ounce.
The rebound of gold prices was hindered after a significant short jump and a low opening, reaching a minimum of $1964.23 per ounce. Currently, it is trading at $1965.89 per ounce.
However, spot gold is currently showing another downward trend, with gold prices approaching $1970 per ounce and plummeting by over $10 on the day.
FXStreet analyst Eren Sengezer pointed out that gold prices rose for the second consecutive week last week, but the recent technical outlook indicates that the gold market is in an overbought state.
Sengezer wrote that after setting its largest weekly increase since March, gold prices have risen for the second consecutive week and have risen to a three month high above $1980 per ounce driven by safe haven demand. This week's economic report will release several important data that may affect the trend of gold, but investors may continue to pay attention to the headline news surrounding the Israel Hamas conflict.
The US Economic Calendar will release several significant data releases this week, starting with Tuesday's S&P Global PMI survey of manufacturing and services. On Thursday, the United States Bureau of Economic Analysis (BEA) will release the initial third quarter gross domestic product (GDP) and the personal consumption expenditure (PCE) price index, which is the Federal Reserve's preferred inflation indicator, will be released on Friday.
Sengezer pointed out that geopolitics may still be the main driving factor behind the trend of gold prices this week. The easing of tensions in the Middle East seems unlikely in the short term, especially as Hezbollah is increasingly embroiled in conflicts.
Analysis of the Prospects of Gold Technology
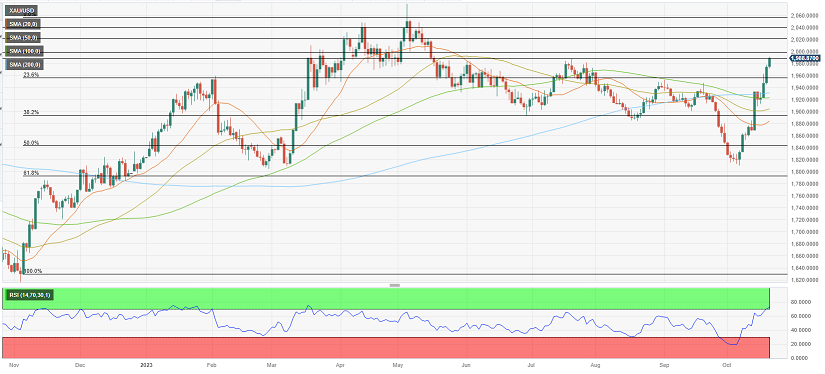
Sengezer stated that the gold daily chart shows that the relative strength index (RSI) has risen above 70, indicating the first technical overbought situation of gold since March. If there is a technical pullback in gold, $1960 per ounce (23.6% Fibonacci pullback in the latest upward trend) will become the first support level before $1930 to $1920 per ounce (200 day moving average and 100 day moving average).
If the daily closing price of gold falls below the support range of $1930- $1920 per ounce, it may hit buyers and open the door for further decline to $1900 per ounce (38.2% Fibonacci retracement, psychological level).

(Spot Gold Daily Chart)
On the upside, Sengezer pointed out that gold prices may face strong resistance at the psychological level of $2000 per ounce. If gold prices rise above this level, technology buyers may take action to push gold prices further up to $2020/ounce and $2040/ounce.
At 08:59 Beijing time, spot gold was trading at $1966.12 per ounce.


