On Friday (September 21st), during the Asian market, spot gold rebounded slightly after yesterday's sharp decline, and the gold price is currently around $1923 per ounce. Valeria Bednarik, Chief Analyst of FXStreet, recently wrote an article analyzing the prospects of gold technology.
Bednarik pointed out that gold prices are technically bearish and may soon fall below the $1900/ounce level.
Spot gold closed Thursday down $10.37, or 0.54%, at $1919.80 per ounce.
The Federal Reserve kept interest rates unchanged as scheduled on Wednesday, but opened the door for another rate hike for the rest of the year, which continued to push the US dollar higher, with gold prices dropping as low as $1913.91 per ounce on Thursday.
Higher US treasury bond bond yields also weighed on gold prices. The yield of two-year US treasury bond reached a peak of 5.202%, the highest level since 2006, and now hovers around 5.14%. Meanwhile, the 10-year US Treasury yield was 4.47%, up 12 basis points on Thursday.
Analysis of short-term technical prospects for gold
Bednarik stated that the daily chart shows that gold prices are currently below all moving averages. At the same time, the technical indicators gained downward traction within a negative level, consistent with sustained selling interest. In addition, gold prices peaked around $1946.10 per ounce this week after a 61.8% decline from $1982.15 to $1884.77 per ounce, followed by a significant decline. The gold price also fell below the 38.2% drop mentioned above, and Fibonacci retreated to a level of 1921.80 US dollars per ounce.
Bednarik added that the gold 4-hour chart also supports the continued bearish trend of gold prices. Gold prices hover around the 200 cycle Simple Moving Average (SMA), while the shorter term moving average gains bearish strength above it. In addition, the technical indicators remain stable below the median line and have hardly lost their bearish potential.
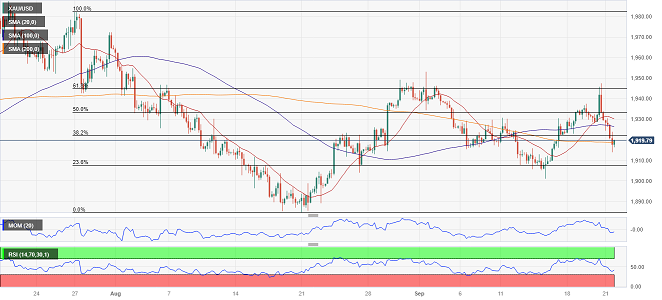
(Spot Gold 4-Hour Chart)
Bednarik provides the latest key support and resistance levels for gold prices:
Support level: 1907.30 USD/oz; 1897.20 USD/oz; 1884.70 USD/oz
Resistance level: 1933.30 US dollars/ounce; 1946.10 USD/oz
At 09:35 Beijing time, spot gold was trading at $1923.13 per ounce.